
Measuring Agent Assist Success Through KPIs, Costs and ROI
A shorter call isn’t automatically a better outcome. Measuring the success of agent assist software means assessing whether it helps resolve customer needs, supports consistent service, improves agent efficiency and delivers value relative to its costs.
That takes more than one headline KPI. Resolution, customer satisfaction, handling time and quality each reveal a different part of the customer and agent experience. Cost and return on investment show whether those improvements make business sense.
This guide explains what agent assist metrics measure and how to assess contact centre performance without letting one number distort the picture. You’ll learn which KPIs to track, how to balance efficiency with service quality, and how to connect measured gains to a practical ROI assessment.
Key Takeaways
- Assess cost per resolved task alongside the wider costs of running and maintaining agent assist.
- Balance efficiency with quality, customer outcomes and safety instead of optimising for speed alone.
- Evaluate the full task journey, including latency, tool calls and the work needed to review or correct outputs.
- Connect contact centre KPIs to business outcomes so performance changes have clear operational meaning.
- Build an ROI view that accounts for measurable savings and gains against implementation costs.
What Are Agent Success Rate Metrics Really Measuring?
Success metrics show whether assistance improves resolution, service quality and efficiency, not simply whether a system produces an answer. Read cost, accuracy and customer outcomes together to understand the value of each resolved task.
Resolution Costs and Total Ownership
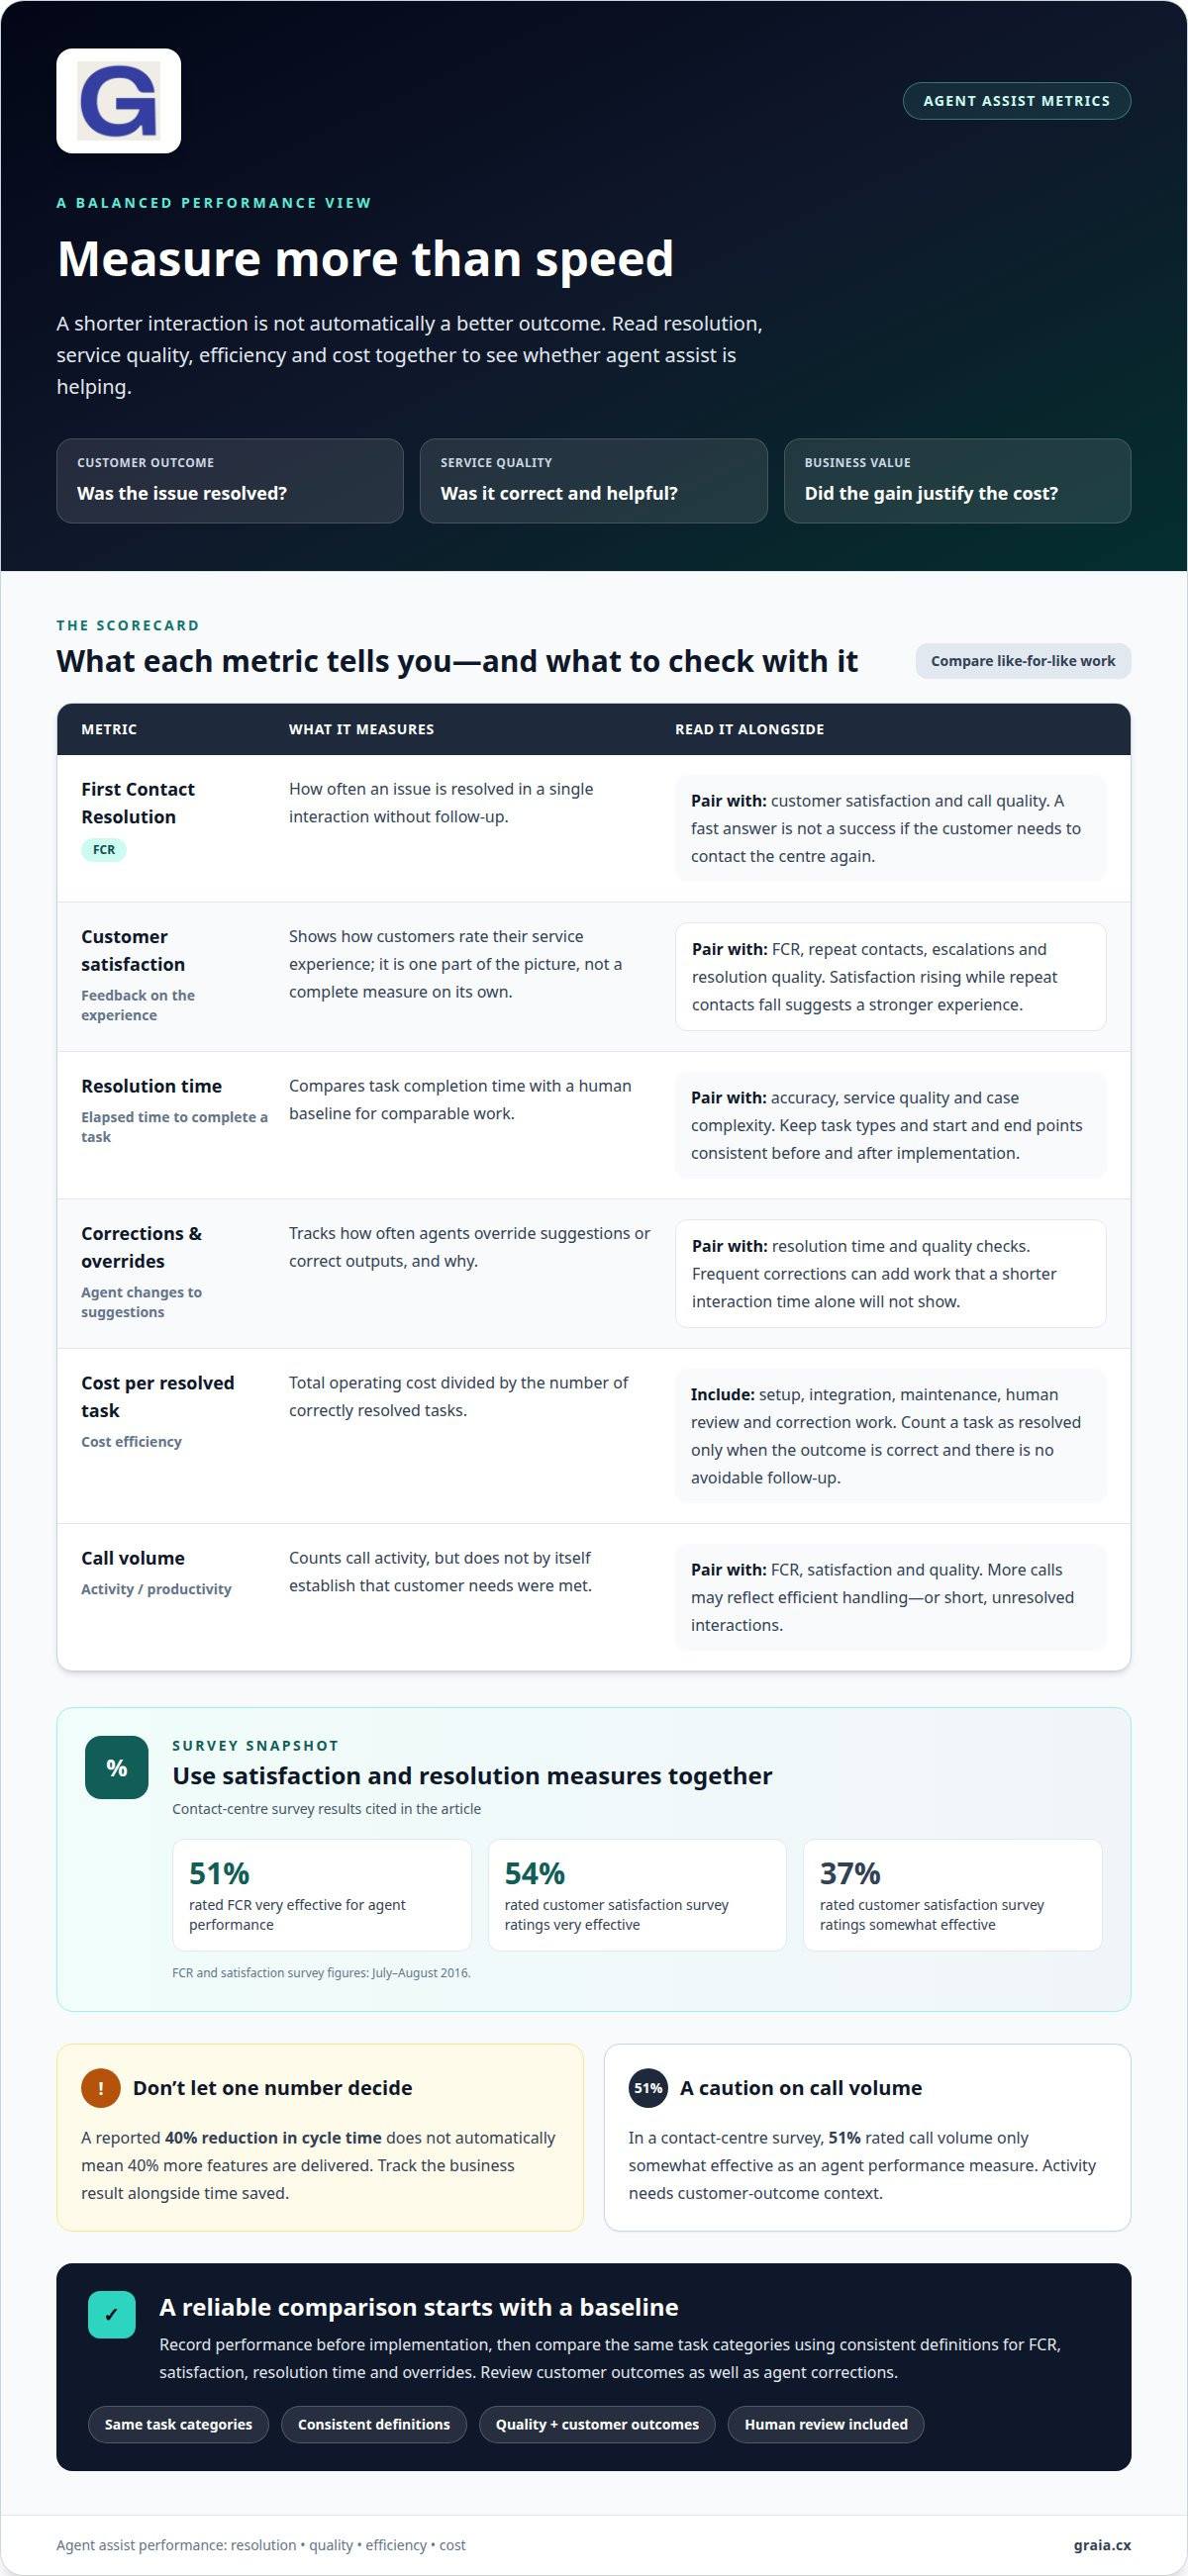
Cost per resolved task is the total operating cost divided by the number of correctly resolved tasks. It matters because a low unit cost can hide expensive setup, integration, maintenance, review and correction work.
Track those costs alongside task volume and resolution quality on a dashboard. Count a task as resolved only when its outcome is correct and the customer doesn’t need avoidable follow-up. Include human review and overrides in the calculation; otherwise, apparent savings may simply shift work to agents. Total cost of ownership gives leaders a fuller view than an isolated software or usage charge.
First Contact Resolution and Satisfaction
First Contact Resolution (FCR) measures how often an issue is resolved in a single interaction without follow-up. It matters because a fast answer isn’t a successful resolution if the customer has to contact the centre again.
Use FCR alongside customer satisfaction rather than treating either as a complete measure. In a July-August 2016 survey, 51% of contact centres rated FCR very effective for agent performance. For customer satisfaction survey ratings, 54% called them very effective and 37% somewhat effective. Track both over time, then review whether changes in resolution align with customer feedback and call quality.
Resolution Time and Human Overrides
Resolution time compares the elapsed time to complete a task with the human baseline for comparable work. It matters because faster handling creates value only when accuracy and service quality remain steady.
Set a baseline using the same task types and start and end points you’ll use after implementation. Separate straightforward enquiries from complex cases, since a different case mix can make average times misleading. Track how often agents override suggestions or correct outputs, and why. A shorter interaction with frequent corrections may increase total handling time, while a longer interaction that resolves the issue correctly may be more effective.
Baselines, Pilots, and Compliance
A baseline records performance before implementation; a pilot tests whether the change improves comparable work. Both help distinguish genuine impact from shifts in demand or case complexity.
Compare like-for-like task categories before and after implementation, using consistent definitions for FCR, satisfaction, resolution time and overrides. For a pilot, choose representative interactions, define success measures in advance, and review customer outcomes as well as agent corrections. Expand only when results support the intended use.
In the UK, using personal data in agent assist requires attention to applicable data-protection and compliance requirements. Assess what data is used, for what purpose, who can access it, how long it is retained, and how generated guidance affects customer interactions. The appropriate controls depend on the system’s data flows and operational use.
Avoiding self-assessment and single-metric optimisation
A credible assessment combines performance measures rather than treating one favourable result as proof of success. A balanced scorecard helps teams monitor service outcomes, quality, efficiency, autonomy and safety together.
Interpreting Metrics Together
Interpreting metrics together means assessing several outcomes against objective evidence, rather than relying on an AI agent’s own claim of success. A fast response can still be inaccurate, incomplete or unsafe.
Pair task completion with quality checks, customer feedback and human review. For example, assess whether a completed task achieved the intended outcome, not just whether the system marked it complete. Combine offline testing against curated cases with live monitoring of production behaviour. Add failures found in real use to the test set, then rerun it when models, prompts or tools change.
A single productivity measure can also overstate impact. A 40% reduction in cycle time doesn’t automatically mean 40% more features are delivered. Track the business result alongside the time saved, so leaders can see whether faster work produces meaningful value.
Customer Satisfaction and Retention
Customer satisfaction and retention measures show whether performance changes improve relationships, not just internal throughput. A quick but unhelpful response may lead to another interaction or weaken customer confidence.
Assess satisfaction feedback alongside repeat contacts, escalations and resolution quality. Read the measures together: rising satisfaction with fewer repeat contacts suggests a stronger experience, while lower handling time alongside more complaints signals a trade-off. Retention can provide a longer-term view, but interpret it carefully because pricing, product changes and other service experiences can influence customer decisions.
Use feedback to focus agent development. If reviews repeatedly identify unclear explanations, coach for clarity; if escalations cluster around complex cases, improve support for those scenarios. Track whether the targeted measure improves without weakening accuracy or customer satisfaction.
Productivity Metrics and Measurement Limits
Productivity metrics quantify activity or output, but can mislead when treated as direct evidence of value. Teams may end up optimising what is easy to count instead of what customers need.
In a contact-centre survey, 51% rated call volume only somewhat effective as an agent performance measure. More calls can reflect efficient handling, but may also indicate short, unresolved interactions. Risks include changing case mix, incomplete data, outputs that pass an automated check but fail in practice, and performance shifts after model or tool changes. These limitations make independent outcome checks essential.
Investigate any metric moving in the wrong direction for two consecutive months. Compare results across task types, review samples of completed work, and check for unintended effects on quality or safety. For a structured perspective on evaluation, explore contact-centre performance insights.
Cost, latency, steps and tool-call efficiency
Efficiency depends on the full path to a correct outcome, not speed alone. Assess task cost, elapsed time and every action required to complete the work.
Agent Costs and Human Time Saved
Comparing agent costs with human time saved means weighing the full cost of an action against the manual effort it replaces. This matters because an apparently quick task may still need review, correction or maintenance.
Include infrastructure, maintenance and human oversight when calculating an agent’s total cost per action. Compare that figure with the fully loaded cost of a person completing the same task. One benchmark suggests keeping agent cost per action at 10-30% of comparable human cost, then below 25% by month six. Above 50%, the economic value may not justify operating the agent at scale.
Time saved also depends on how much work remains after generation. Routine tasks may initially take 40-60% of human time, then 20-40% by month three and 10-25% by month six. Measure the complete task, including specification, review and correction, rather than counting only the agent’s processing time.
Cost per Agent Action
Cost per agent action is the total cost of completing an action divided by the number of successful actions. It helps teams assess whether automation uses resources efficiently while delivering an objective result.
Assess the full trajectory: the plan, tool calls, intermediate steps and final output. Track cost per task alongside latency and the number of steps or tool calls. If latency falls but tool calls multiply, total cost may rise without improving the customer outcome. Compare similar tasks, since a complex enquiry and a routine update require different action paths.
Then connect efficiency to business value. ROI can be assessed by considering cost savings and revenue gains alongside implementation costs. This gives leaders a consistent way to compare operational savings with gains influenced by improved service, rather than treating lower processing cost as the whole return.
Review the balance over time. A task that requires repeated tool calls or extensive human correction may need a simpler workflow, a different model or manual handling. Conversely, a stable action sequence that reduces human effort while preserving accuracy can support expansion. Include maintenance and review in each comparison, so efficiency reflects sustained operating costs, not a single successful run.
Which Agent KPIs Are Contact Centers Tracking?
Contact centres track operational measures to understand what happens during interactions. Leaders need to connect those measures to business outcomes, including service quality, efficiency and customer experience.
Operational Metrics and Business Outcomes
Operational metrics describe activity; business outcomes show its effect on customers and the organisation. Linking the two helps leaders determine whether a change in agent performance creates meaningful value.
For example, call quality can indicate whether interactions meet service expectations; resolution outcomes show whether customers’ needs were addressed. A July-August 2016 survey found that 70% of contact centres rated call quality a very effective performance measure, while 25% rated it somewhat effective.
Review operational indicators regularly, then assess how they relate to outcomes. Daily dashboards can show completion and error trends; monthly reviews can test whether those trends align with wider business goals.
KPIs Aligned with Business Goals
Aligned KPIs connect each performance measure to a specific business objective. They matter because a measure can improve without advancing the outcome leaders actually value.
Start with the objective, such as improving service quality or reducing avoidable effort. Select operational measures that can plausibly influence it, then pair them with an outcome measure. For example, track call quality alongside customer feedback rather than treating shorter calls as proof of better service.
Contact centres have used different measures to represent performance. In the same July-August 2016 survey, 41% rated schedule adherence very effective, while 28% did so for call length. These differences reinforce the need to choose measures that fit the goal.
Adoption and Usage Measurement
Adoption and usage measures show whether agents use available assistance during eligible interactions. Low usage can limit impact, while frequent use alone doesn’t prove better outcomes.
Track how often guidance appears, whether agents accept or act on it, and what happens to the interaction afterwards. Distinguish availability from active use: a suggestion shown on screen may be ignored, while an accepted suggestion may still need correction.
Historical measurement was often fragmented. In a July-August 2016 survey, 90% of contact centres used multiple systems or applications to track performance, and 44% manually integrated data using spreadsheets. That makes consistent definitions and joined reporting important for interpreting usage.
Attributing Performance Improvements
Attribution means testing whether changes in performance are associated with assistance, rather than assuming the tool caused them. It matters because staffing, case mix and demand can also shift results.
Compare similar interaction types before and after implementation, using stable KPI definitions. Where practical, compare groups or periods with different exposure to assistance, while accounting for differences in complexity. Track adoption alongside outcomes so leaders can see whether performance changes correspond with actual use.
Among surveyed contact centres, 22% tracked performance in real time; the figure was 31% among those using automated or custom data integration. Combine timely operational monitoring with monthly business-outcome reviews to distinguish short-term movement from sustained change.
Calculating agent return on investment
ROI connects the value created by an agent assist deployment with the resources required to implement and operate it. A credible assessment combines time savings, resolution outcomes, cost changes and any revenue gains influenced by improved service.
Calculating Real Time Savings
Real time savings compare the human effort required before deployment with the total effort afterwards. Processing speed alone can overstate the benefit if review and correction still take substantial time.
Use comparable tasks and record the complete workflow: preparation, agent output, review, corrections and final resolution. One illustrative comparison starts with a task taking two hours manually and 15 minutes with an agent, then accounts for specification, review and correction. The total is 45 minutes, so the actual saving is 75 minutes, not 105.
Apply this approach to a representative set of interactions. Separate routine work from complex enquiries, then calculate saved human time by comparing the full manual baseline with the full assisted process. Link those hours to reduced workload or capacity used elsewhere, rather than assuming every saved minute becomes a cash saving.
ROI Calculation Scenarios
ROI scenarios estimate how savings and revenue gains relate to implementation cost. A deployment can influence several outcomes, and each should be clearly connected to observed performance.
Use this calculation: cost savings plus revenue gains, divided by implementation cost. Build separate scenarios for handling-time reductions, productivity changes, fewer errors or customer outcomes that influence revenue. Make assumptions visible and distinguish measured gains from projections. Don’t count the same benefit twice, such as recording saved handling time as both labour savings and increased productivity.
For each scenario, define the period, affected interactions and evidence supporting the change. Compare the observed success rate and resolution quality with the baseline, then attribute only the portion plausibly linked to the deployment. Include implementation and ongoing operating costs, not just initial expenditure.
Enterprise leaders can strengthen the decision by testing a conservative case alongside the central scenario. If time savings depend on agent adoption, model only work where assistance is used. If revenue gains depend on customer satisfaction, connect that claim to measured customer outcomes instead of assuming a direct causal link. This makes ROI useful for deciding whether to expand, refine or limit deployment.
Use these evaluation principles to shape a grounded business case with practical contact-centre insights.
GraiaCX: Agent Assist
GraiaCX helps contact centres put performance insights into practice with Agent Assist, which provides agents with real-time assistance, including next-best-action suggestions. This can be relevant when teams want to support agent efficiency while keeping human judgement central to customer interactions.
Its Agentic Omni-Channel Platform combines voice, chat, email and social messaging with AI-driven automation. The Conversational Agent can understand intent and emotion, resolve routine enquiries autonomously, and complement agent-led support. Live Call Translation supports multilingual conversations in over 100 languages, helping teams serve customers without relying on bilingual staff.
Use the KPIs in this guide to define the outcomes that matter, then consider how AI assistance fits your contact centre’s workflows and measurement approach. Schedule a consultation with GraiaCX to discuss your requirements.
Turn measurement into your next move
The next step is to make evaluation part of how your contact centre evolves. Use the outcomes that matter to your organisation to shape a focused assessment, then let the evidence guide where human support, automation and agent guidance can have the greatest impact.
Measuring the success of agent assist software is most valuable when it informs decisions beyond the initial deployment. It can help teams identify where agents need better support, where routine interactions could be handled differently, and where the customer experience deserves renewed attention.
GraiaCX brings together Agent Assist, Conversational Agent and Live Call Translation to support contact centre interactions in different ways. If you’re considering how these capabilities could fit your operational goals, discuss agent assist with GraiaCX.
Base your next decision on meaningful outcomes, and give your team a clear path to keep improving.
Frequently Asked Questions
What's a good task completion rate?
A useful benchmark depends on task complexity and how much human review remains. Suggested AI agent completion targets rise from 60-70% in the first month to 80-85% by month three, then 90-95% by month six. Treat these as progression markers, not universal pass rates. Define completion as an objectively verified result, and distinguish routine tasks from cases where an incorrect action could carry greater consequences.
Which KPIs measure the success of agent assist software?
Use a balanced set of measures: first contact resolution, customer satisfaction, call quality, handling time, suggestion acceptance, correction or override frequency, and cost per resolved task. Choose KPIs that reflect your contact centre’s goals, then review them together. For example, shorter calls alongside more repeat contacts may signal poorer resolution. Measuring the success of agent assist software means checking real customer and operational outcomes, not relying on software-generated completion claims alone.
How does agent assist software affect average handling time and first contact resolution?
Agent Assist can help reduce average handling time by surfacing relevant information or next-best actions during an interaction. It may also support first contact resolution by helping agents address an issue without avoidable follow-up. The effect depends on whether guidance is relevant, accurate and usable in the workflow. Compare similar enquiry types, and include after-call work and corrections when assessing handling time, not just the conversation itself.
How can agent assist impact customer satisfaction and agent experience?
Relevant prompts and timely information can help agents respond more clearly and consistently, supporting smoother customer interactions. Assistance may also reduce the effort agents spend finding information or deciding what to do next. Assess both experiences through customer feedback, quality reviews and agent feedback. For example, investigate whether a new prompt helps with a recurring enquiry or disrupts an established conversation.
What is the typical ROI of agent assist software, and how is it calculated?
There’s no single typical ROI that applies across contact centres, because results depend on usage, implementation costs and the outcomes improved. A practical calculation divides cost savings plus revenue gains by implementation cost. Build the assessment from measured changes, such as reduced manual workload or improved service outcomes, and include operating costs. Keep assumptions separate from observed results, so projected gains aren’t mistaken for realised returns.